
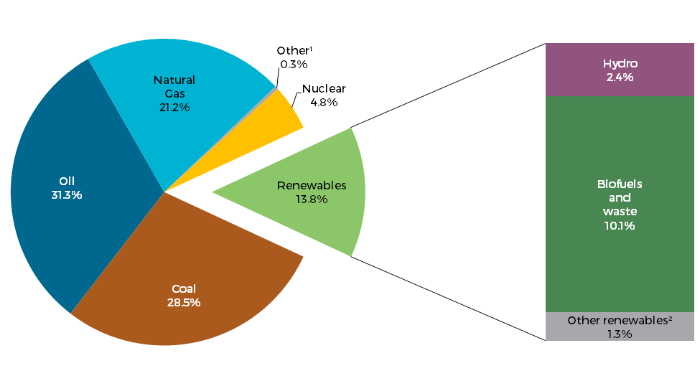
World production of renewable energy grew 2.6% between 2013 and 2014, reaching 1,894 Mtoe by the end of the year. This represents around 1/7th (13.8%) of the total Primary Energy Supply (TPES) of 13,700 Mtoe (Figure 1).
Figure 1: 2014 fuel shares in world total primary energy supply
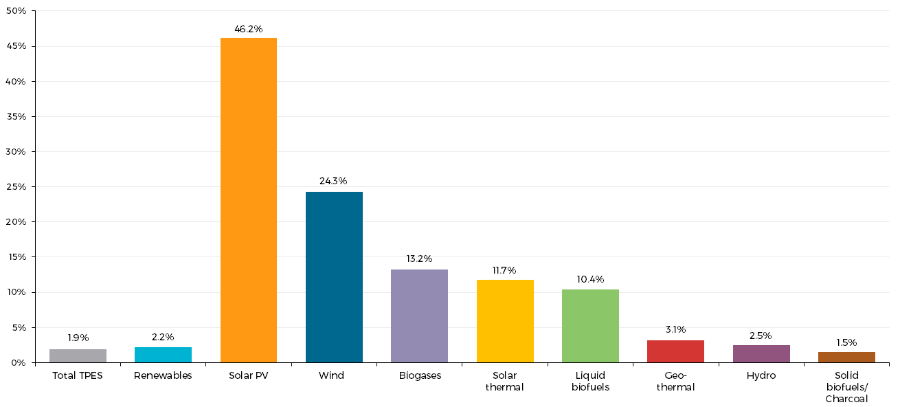
Since 1990, energy from renewable sources has grown at an average annual rate of 2.2%, higher than the 1.9% growth rate of TPES (Figure 2). Growth has been especially high for solar photovoltaic and wind power, at 46.2% and 24.3% respectively, driven primarily by OECD countries and China. Hydro and solid biofuels remain the most used form of renewable energy, and grew in line with overall TPES of 2.5% and 1.5% per year respectively.
Figure 2: Annual growth rates of world renewables supply from 1990 to 2014
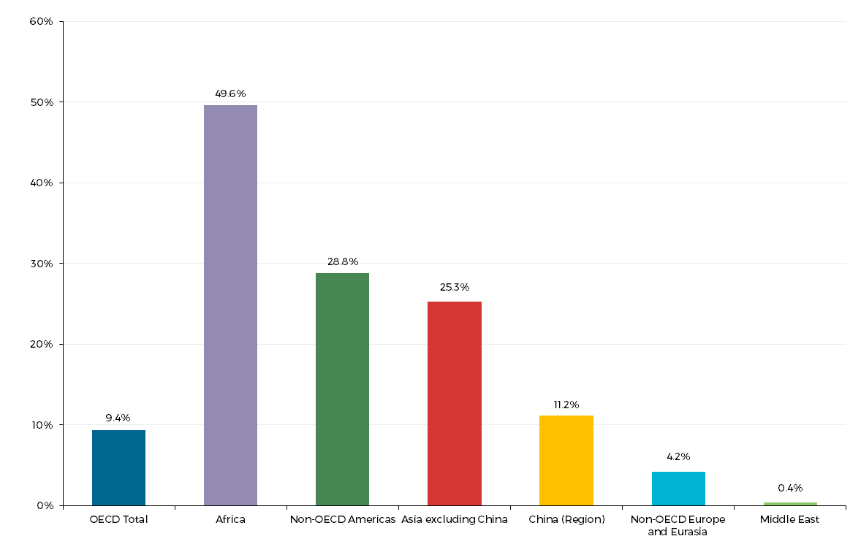
Non-OECD countries consume around ¾ of all renewables, reflecting the use of solid biomass (e.g. wood) by households. As a result, nearly half of all energy in Africa is renewable, whilst it accounts for a quarter of energy used in Asia (excluding China) and Non-OECD Americas. In OECD countries, however, the share of renewables in total energy supply is only 9.4%.
Figure 3: 2014 shares of renewables of regional total primary energy supply
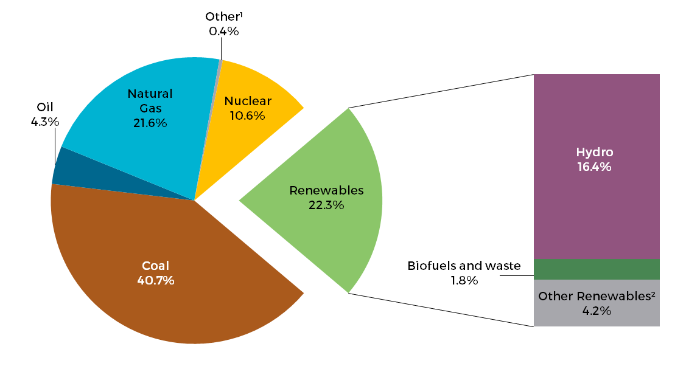
Renewables are now the second largest source of global electricity production, accounting for 22.3% of world generation in 2014. Renewables come in behind coal (40.7%), and ahead of gas (21.6%), nuclear (10.6%) and oil (4.3%).
Hydroelectricity supplies the vast majority of renewable electricity - 73.2% in total – which represents 16.4% of world electricity generation. Following rapid recent growth, solar, wind, geothermal, and tide energies accounted for 4.2% of world electricity production in 2014 and 18.7% of total renewable electricity. Since 1990, renewable electricity generation worldwide has grown on average by 3.6% per annum, slightly above the total electricity generation growth rate of 2.9%.
Figure 4: Fuel shares in world electricity production in 2014
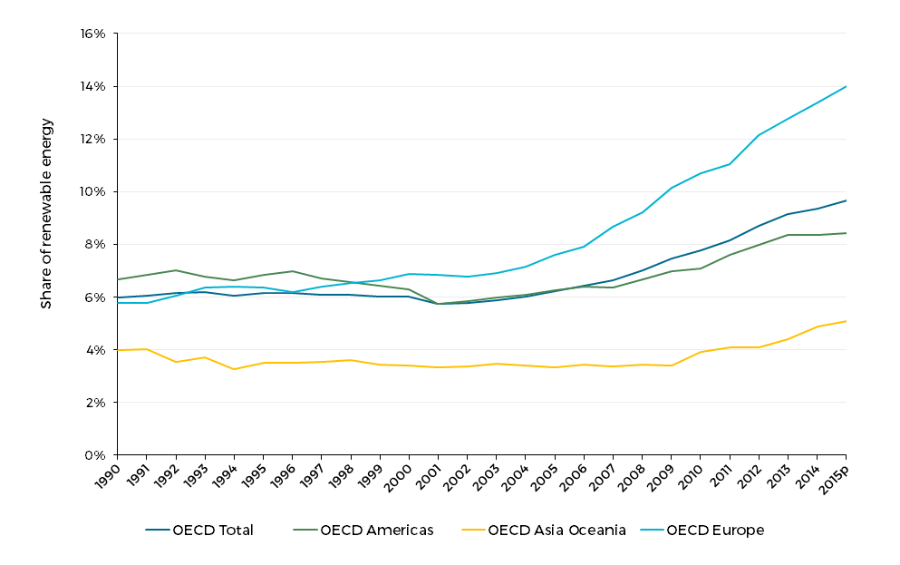
Electricity production from renewable products in the OECD grew 3.8% from 2014 to 2015, reaching 2,471.1 TWh. This represents nearly a quarter (23.0%) of total OECD electricity production in 2015 (Figure 5), the largest share of renewables in gross electricity production for any year in the renewables time series (from 1990).
Figure 5: OECD regional shares in renewable electricity production from 1990 to 2015
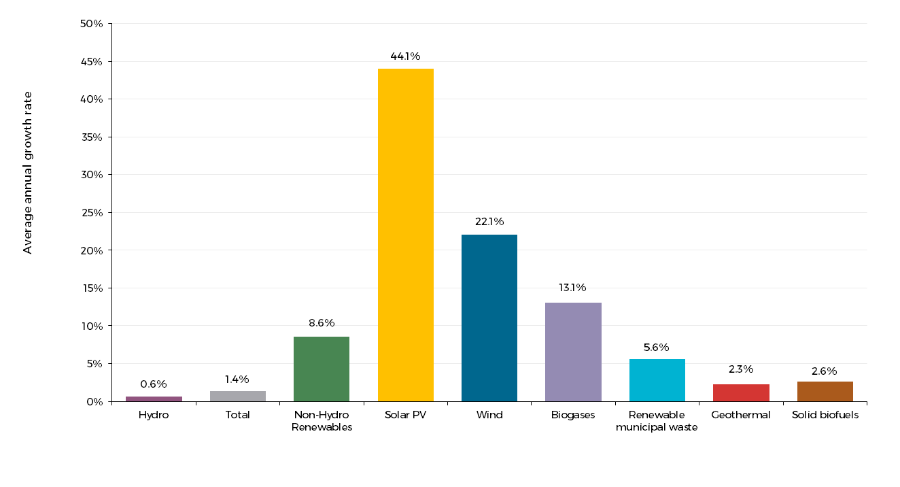
In 1990, wind, biogases and liquid biofuels represented less than 0.6% of renewable electricity combined. Between 1990 and 2015 these technologies grew much faster than any other power source (Figure 6), with wind power experiencing the most notable growth - from just 0.3% of renewable electricity in 1990 to 22.9% in 2015. This represents an average annual growth rate of 22.1%, making it the second largest renewable electricity source. The share of solar PV in OECD renewable electricity production increased from a negligible amount to 7.1% in the same time period, and biogases increased from 0.3% to 3.2%. All of these sources experienced higher average growth rates than mature technologies such as hydro power (0.6%), solid biofuels (2.6%) and geothermal (2.3%). As a result, non-hydro renewable electricity production experienced 8.6% annual growth between 1990 and 2015.
Figure 6: Annual growth rates of electricity production between 1990 and 2015 in OECD countries
Notes
The data referenced here are available in the Renewables database and book. A summary of the findings is available for free download here. All 2015 data are provisional.
Source: © 2016 OECD/IEA