
Electricity Production
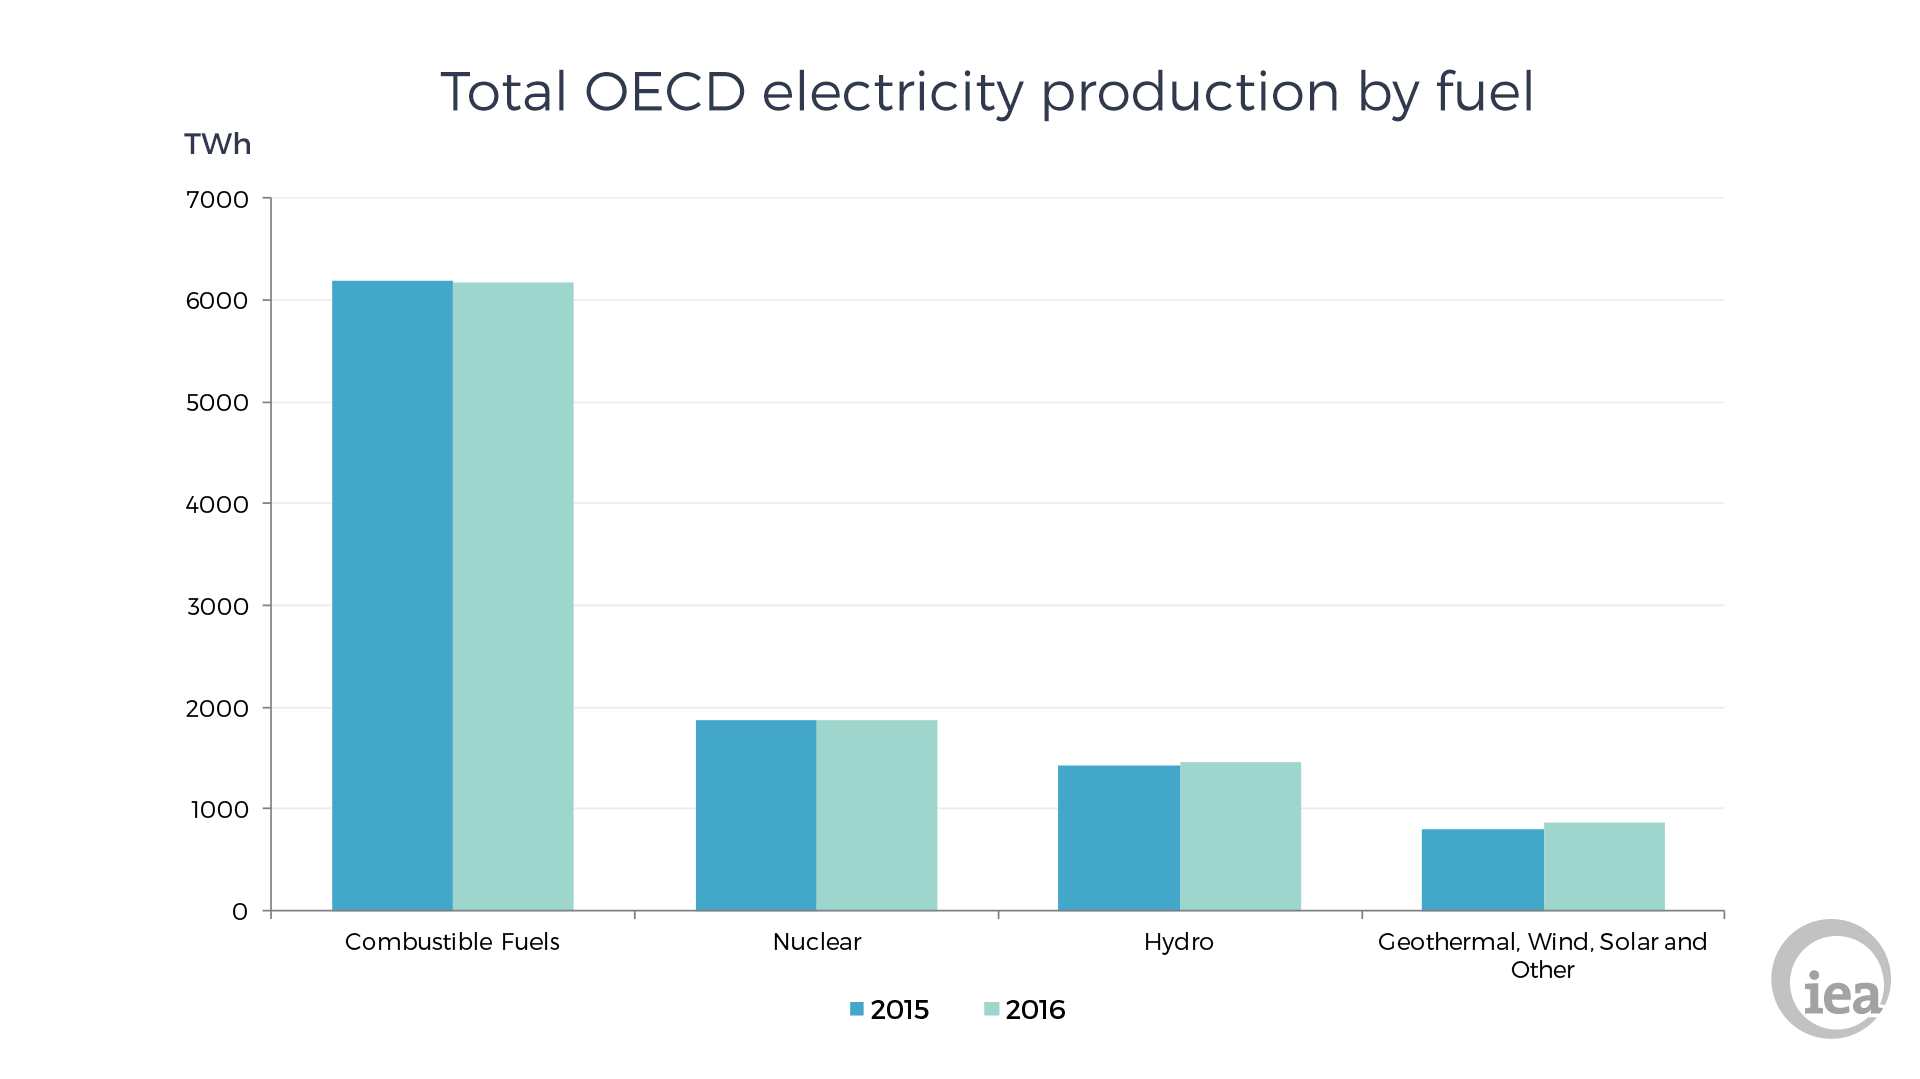
An assessment of monthly data shows that in 2016, OECD net electricity production grew by 0.9% compared to 2015. Within this small overall change there was a large increase of 9.5% in Geothermal, Solar, Wind and Other renewables1 generation and a smaller, but still significant, increase of Hydro, 2.2%. Combustible Fuels2 and Nuclear fell by 0.2% and 0.1%, respectively.
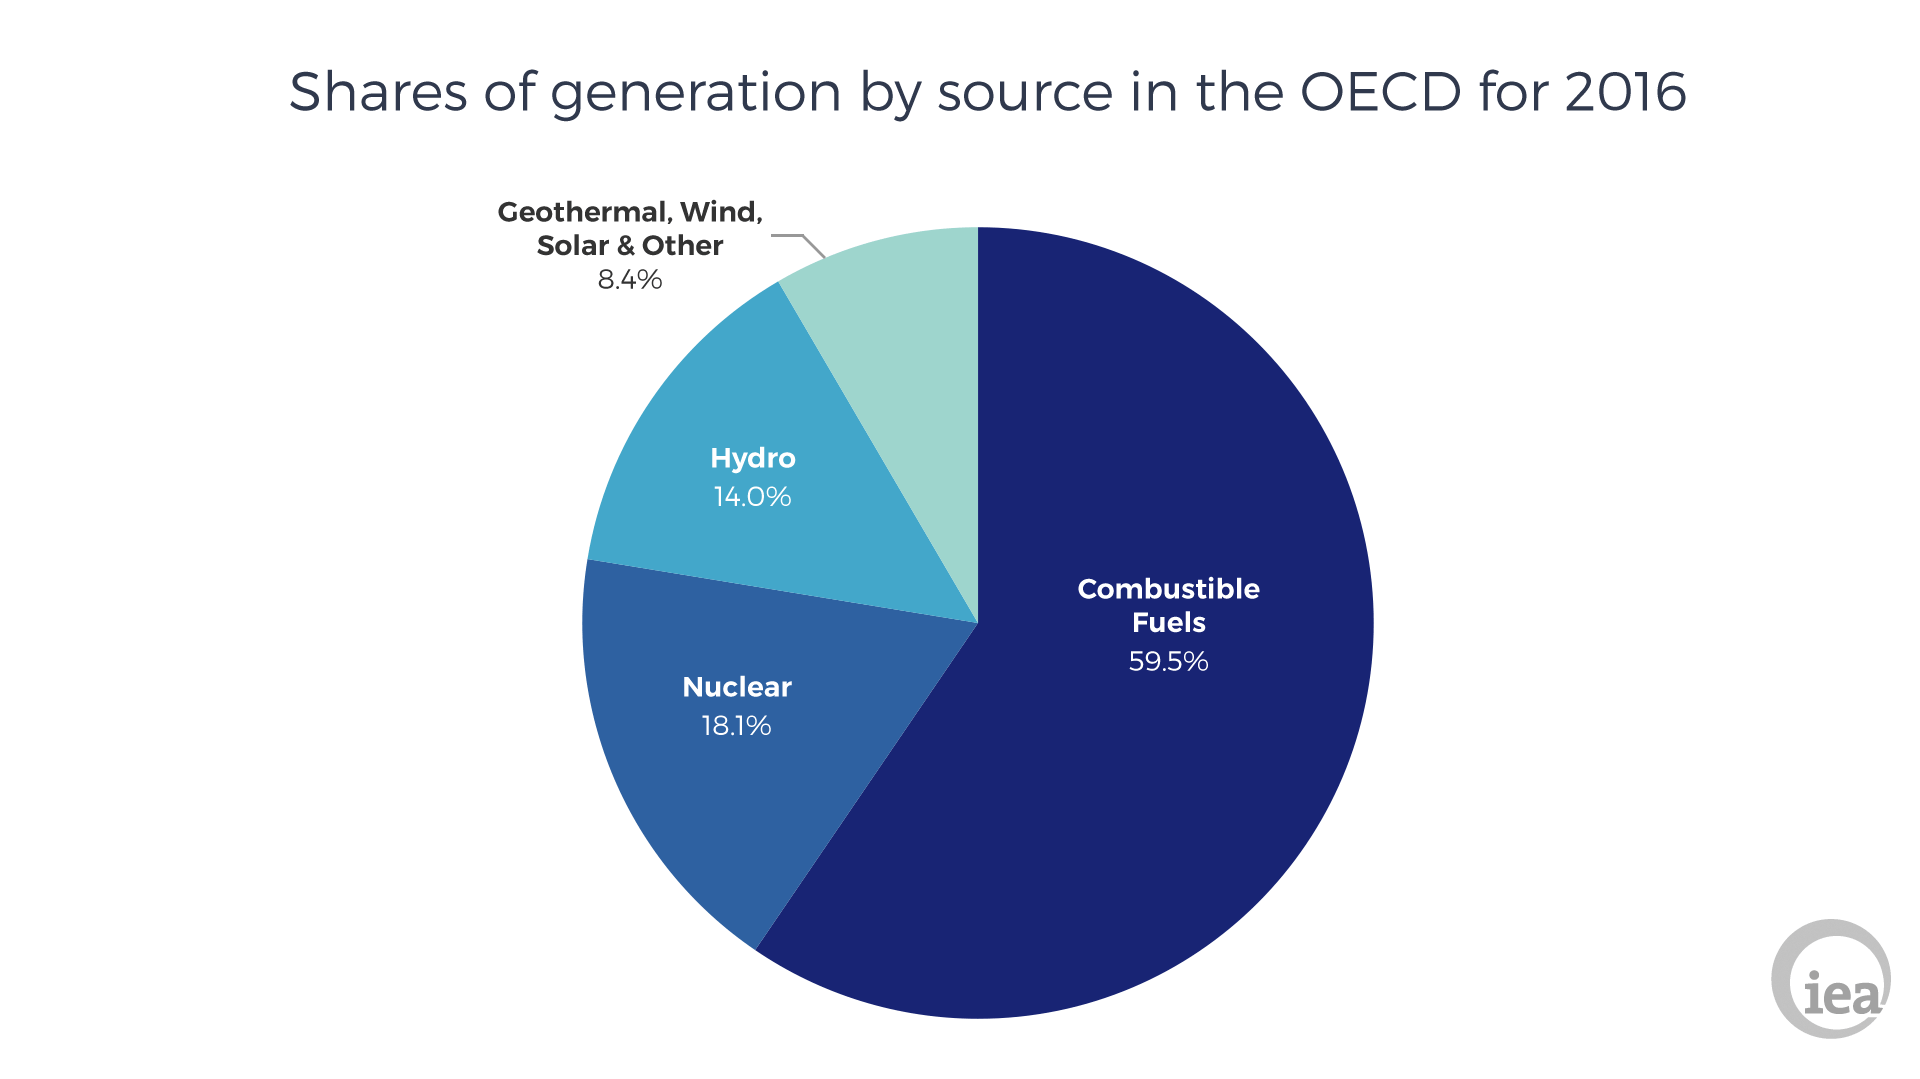
In the OECD, non-combustible renewables accounted for 22.4% of all generation compared to 21.6% in 2015. The share of production from combustible fuels (including combustible renewables) fell by 0.7 ppt to 59.5%, with the remainder, 18.1%, made up from nuclear – virtually unchanged from 2015.
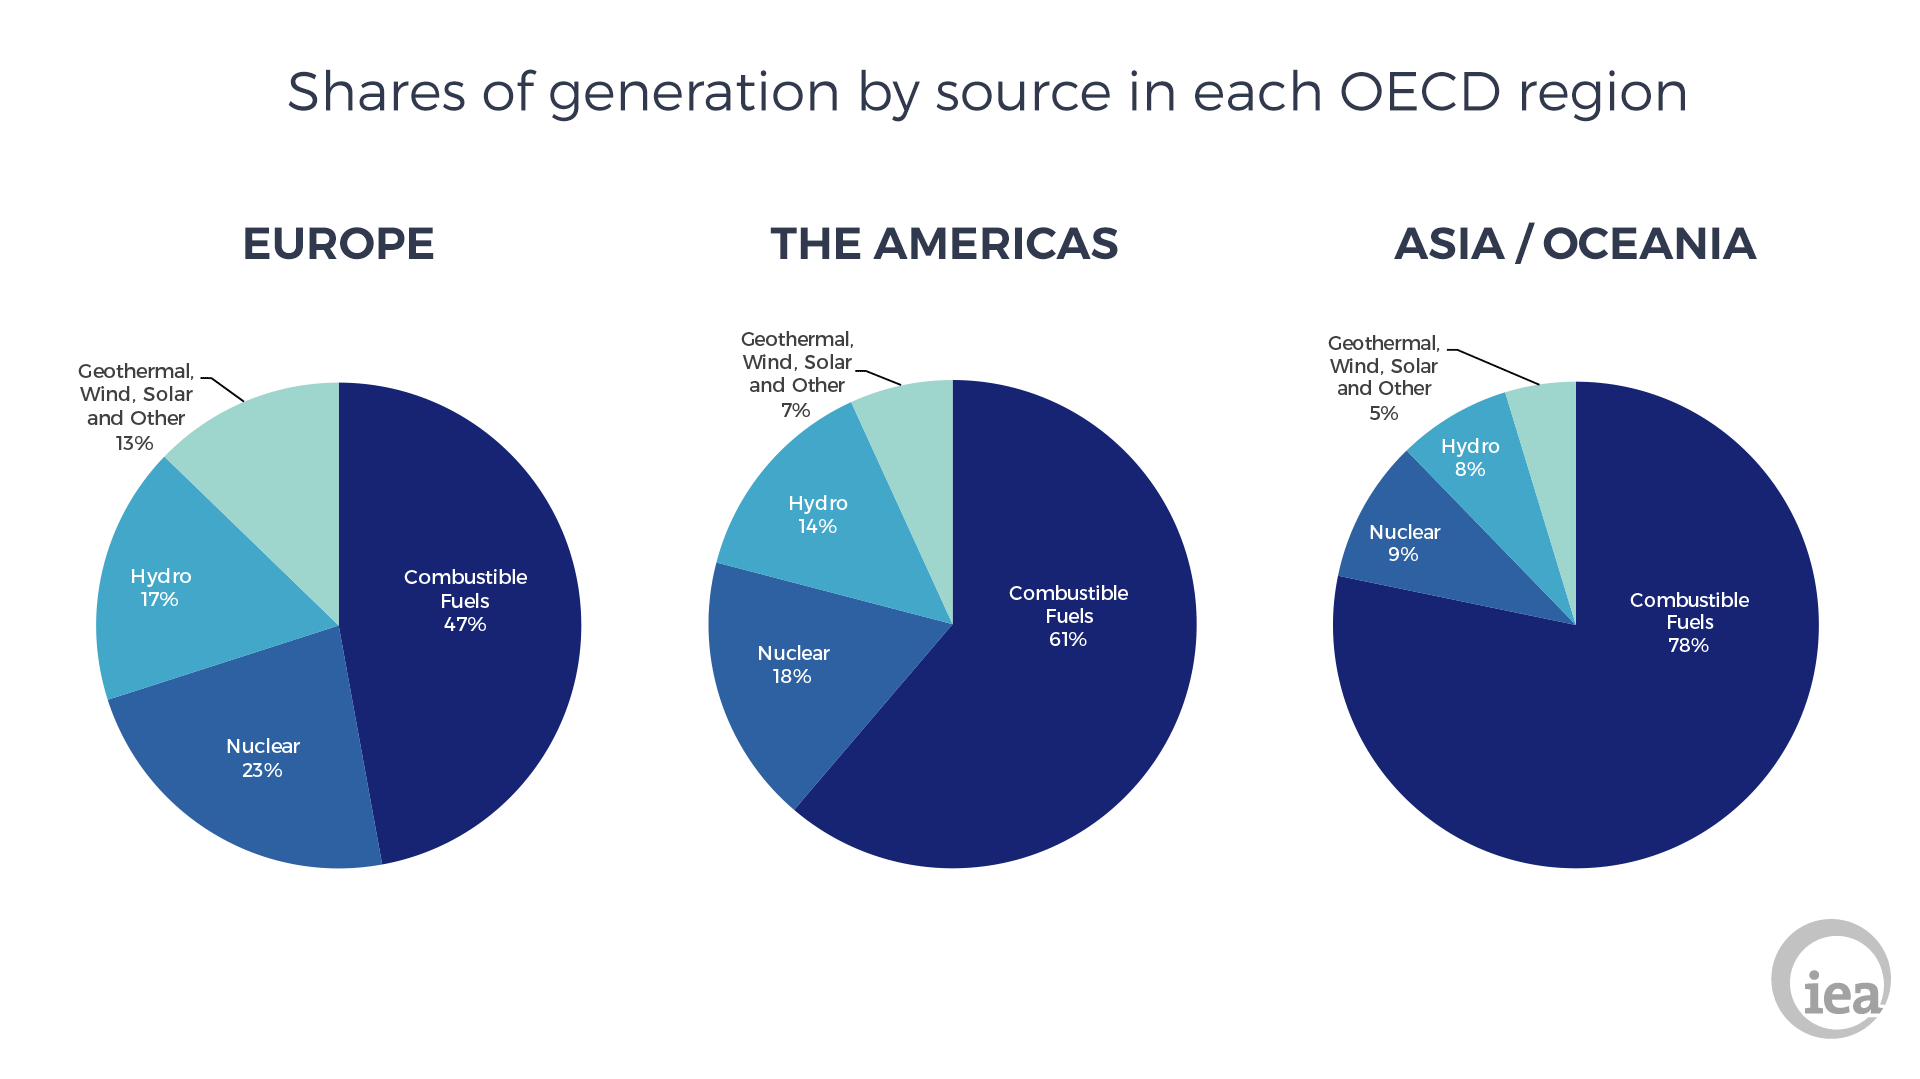
Overall production rose by about 0.9% in the OECD, but each OECD region saw different changes in production shares by fuel type during 2016. In OECD Americas (hereafter, “the Americas”), Combustible Fuels dropped by 1.5% while Nuclear increased 0.7%, Hydro increased by 3.2% and Geothermal, Wind, Solar and Other renewables increased significantly by 22.5%. OECD Asia/Oceania (hereafter, “Asia/Oceania”) showed the same trends, with Combustible Fuels dropping 0.5% but increases in Nuclear, 6.6%, Hydro, 1.4%, and Geothermal, Wind, Solar and Other renewables increasing the most, 12.6%. OECD Europe (hereafter, “Europe”) showed a different trend with the largest increase coming from Combustible Fuels, 2.6%, and a smaller increase in Hydro of 1.0%. Other non-combustible renewables remained virtually flat while the only decrease came from Nuclear, 2.4%.
In terms of shares of generation, non-combustible renewables accounted for 30% of generation in Europe compared to 21% in the Americas and 12% in Asia/Oceania. Combustible Fuels remain the dominant source of electricity and accounted for 61% in the Americas, 78% in Asia/Oceania and 47% in Europe. Nuclear produced 23% in Europe, 18% in the Americas and 9.5% in Asia/Oceania.
Combustible Fuel
Total OECD cumulative production of electricity from combustible fuels in 2016 was 6 174.3 TWh, which was 12.9 TWh, or 0.2%, lower than in 2015. This comprised reductions in Asia/Oceania and the Americas of 0.5% and 1.5% but an increase in Europe of 2.6%.
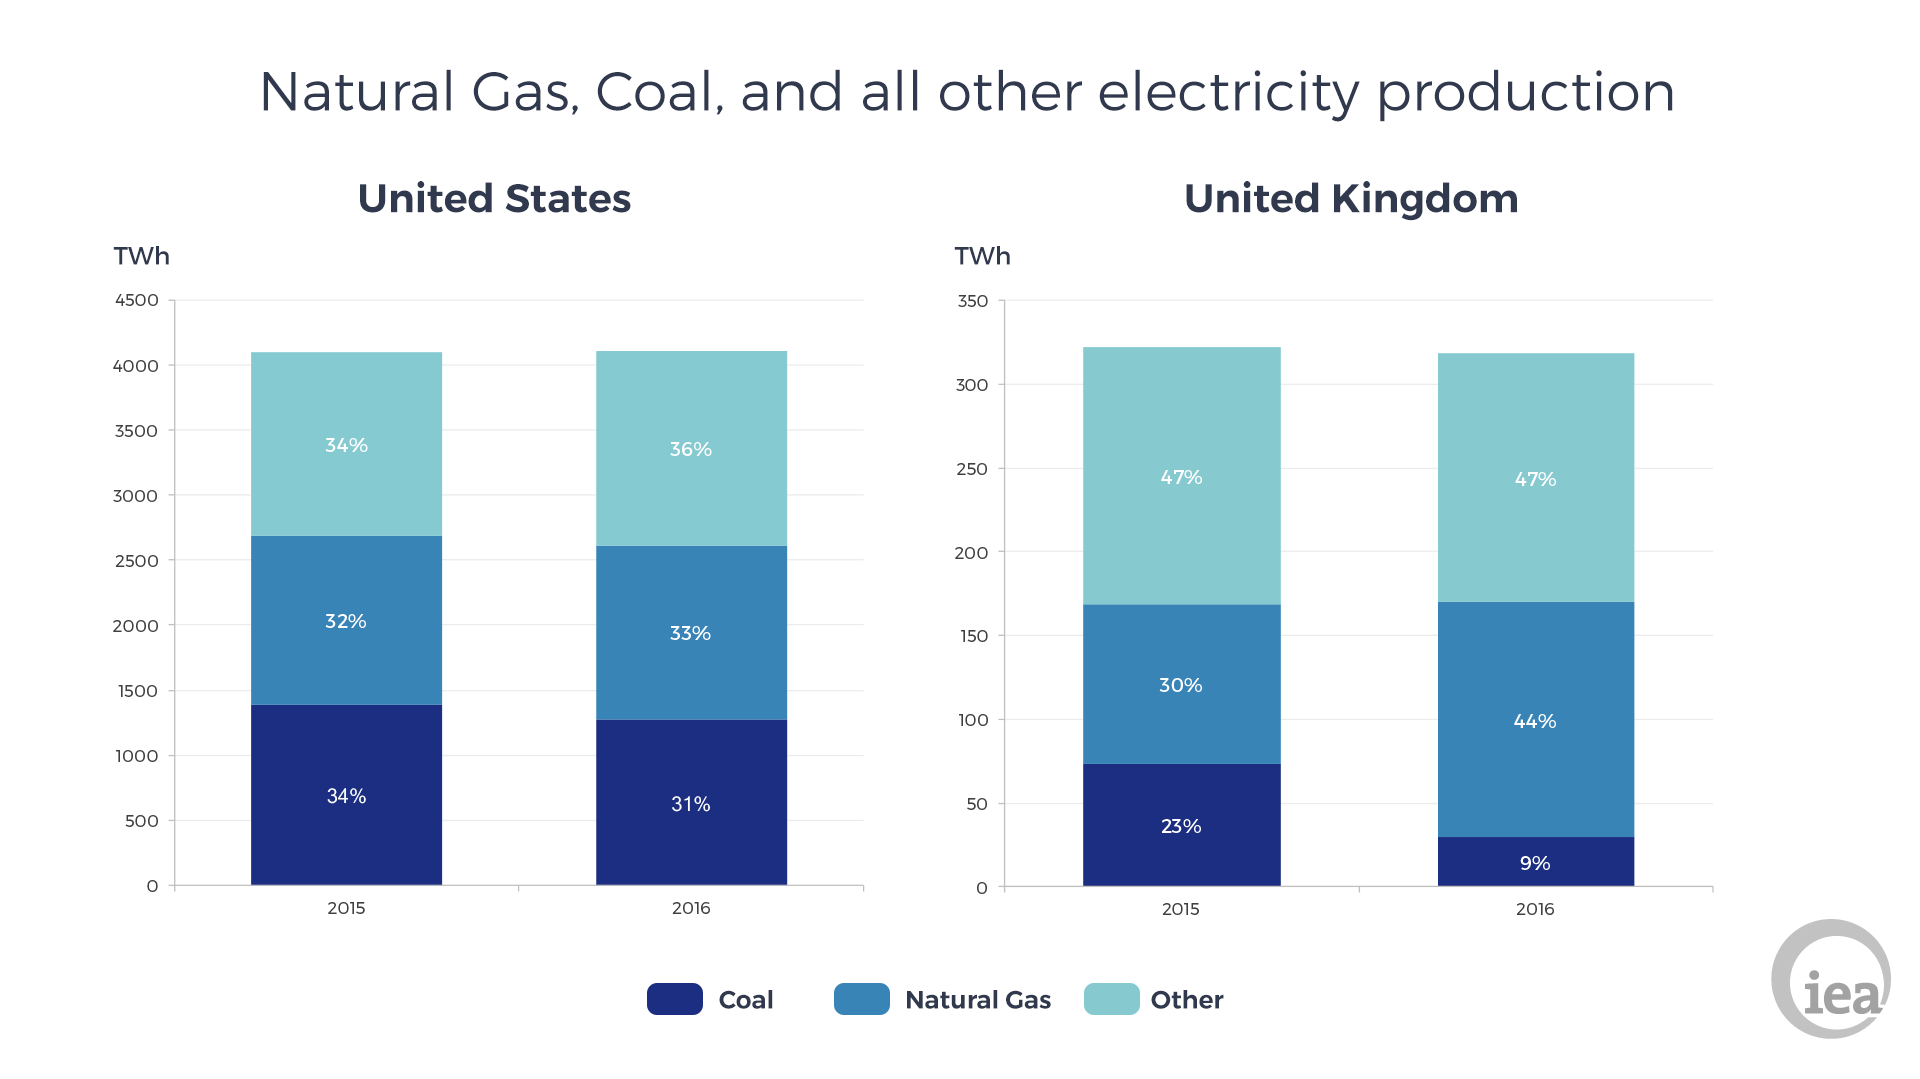
One element within Combustible Fuels was the switch from coal to natural gas in the United States and the United Kingdom, continuing the trend from within the last year. In 2016, the United States reduced use of coal plants in favor of natural gas plants due to the low price of natural gas. The same trend was seen in the U.K., although the shift was larger with the added influence of carbon pricing in the U.K.
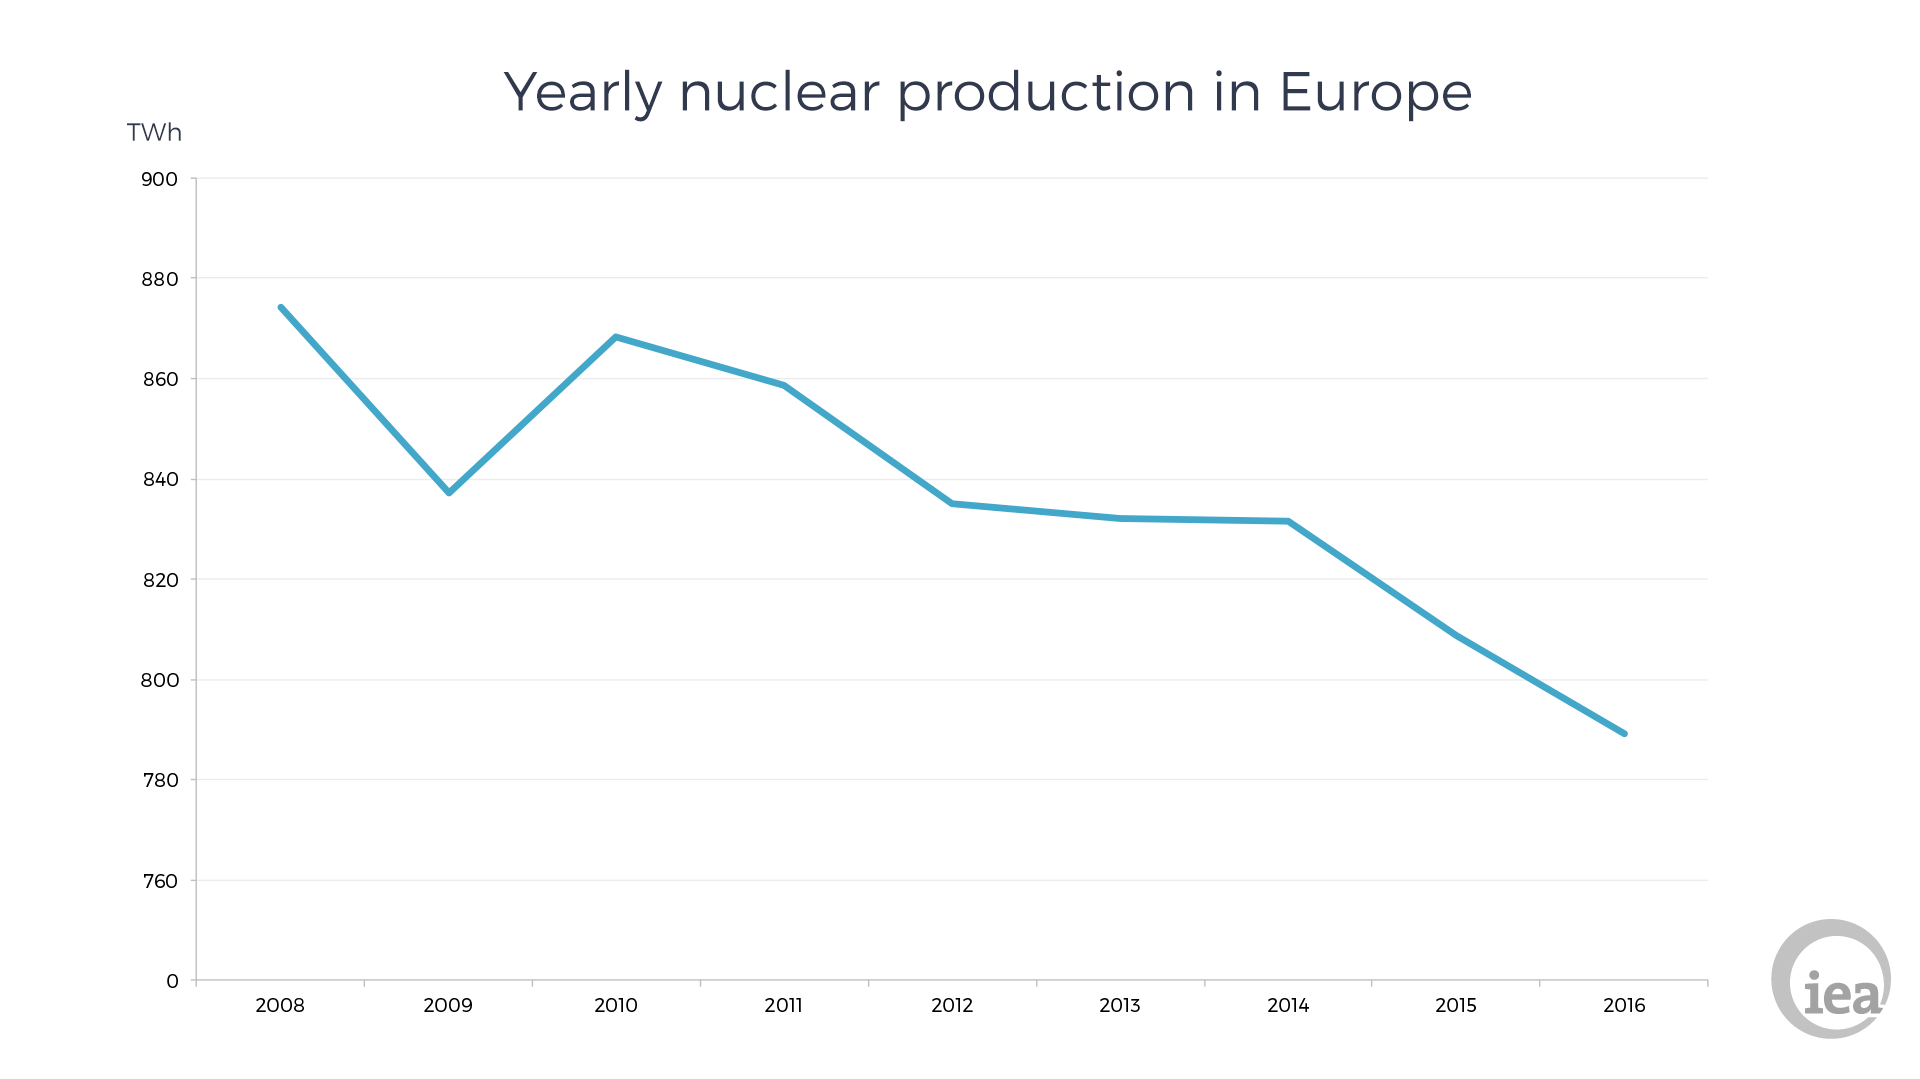
Nuclear Electricity
Total OECD cumulative production of nuclear electricity in 2016 was 1 873.6 TWh, 2.7 TWh, or 0.1% lower than in 2015. Europe was the only region which decreased its nuclear production, by 19.6 TWh, or 2.4%, to 790 TWh led by the continued phase out of nuclear electricity in Germany as well as decreases in the Czech Republic and France caused by extended outages. There were also operational outages in Slovenia and Switzerland.
Hydro Electricity
Total OECD production of hydroelectricity in 2016 was 1 451.6 TWh, which was 30.7 TWh, or 2.2%, higher than in 2015, and increased in each OECD region. From 2000 to 2015, Hydro production has only grown 0.8% because most of the available potential in OECD countries is already utilised. The increase in Hydro for 2016 was predominately a result of higher rainfall in many countries, especially in Canada, the United States and Norway, the top three Hydro producers in the OECD. These increases compensated for significant drops of Hydro production in Finland and Sweden.
The largest percentage increase throughout the OECD was seen in Portugal, 173% higher in 2016 than the average Hydro production during the 2005 - 2015 period and 73% higher in 2016 than in 2015. This allowed for the highest level of electricity exports to Spain since 2005. As Spain increased its use of electricity imports, from Portugal and other countries, it saw the lowest level of indigenous production in 2016 since 2005.
Geothermal, Solar, Wind and Other Renewables
Total OECD production of electricity from Geothermal, Solar, Wind and Other renewables was 873.9 TWh in 2016, which was 75.6 TWh, or 8.4%, higher than in 2015, with increases seen in all OECD regions. Europe had the smallest increase in this category of 1.9 TWh, or 0.4%. In Asia/Oceania, there was an increase of 9.6 TWh, or 12.6%. The Americas rose the most with 64.1 TWh, or 22.5%, driven by increases in U.S. Solar and Wind of 45% and 19%, respectively.
The European trend contrasts with last year, when Europe showed the highest increases of all of the OECD regions. Solar and Wind dominate, producing roughly 25% and 70%, respectively, of the electricity in this category for Europe and whilst it was a good year for European Solar production, which increased 4 337 TWh, or 4%, Wind production fell 1%. Germany, which produced roughly 28% of the European Solar and Wind for 2016, had decreases of 1% and 7%, respectively, due to weather conditions. With the aforementioned phase-out of Nuclear, this necessitated an increase in Combustible Fuels.
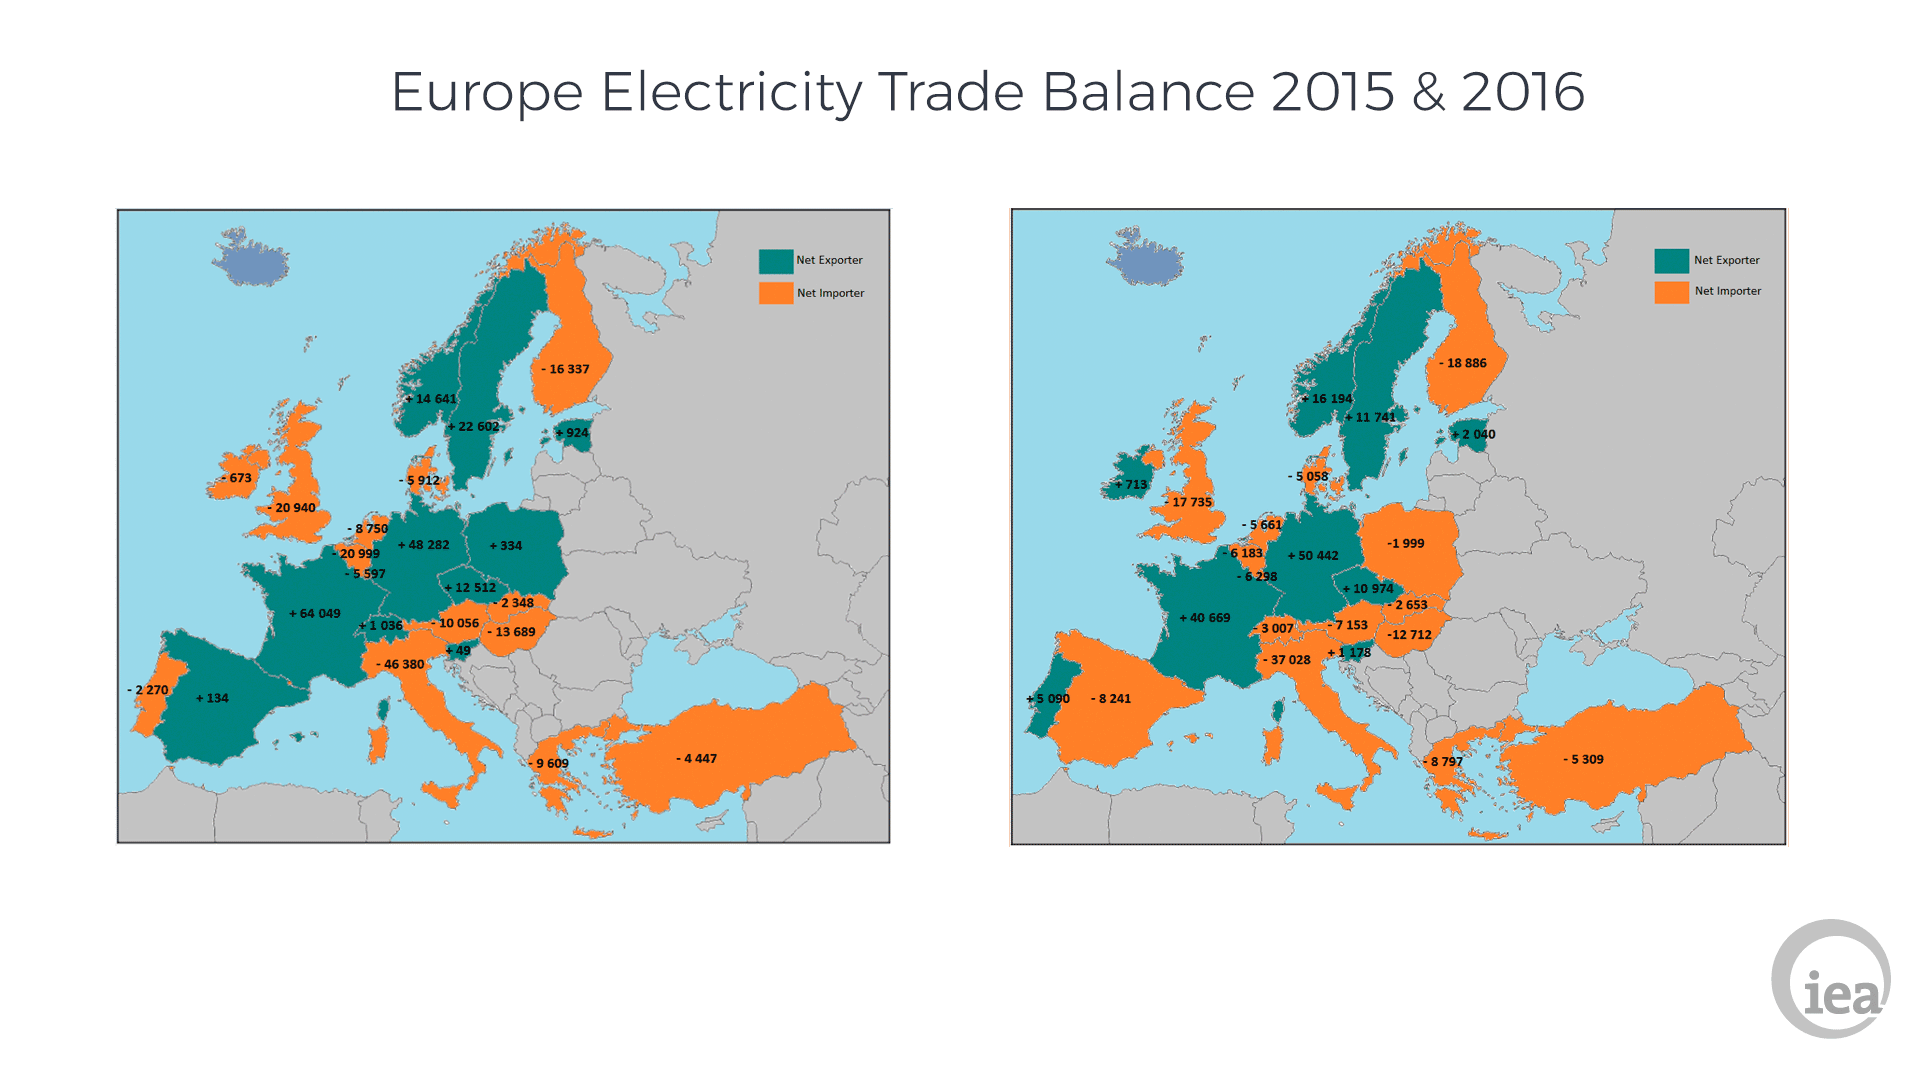
Electricity Trade
Total OECD electricity trade is representative of trade in Europe and the Americas3 since there is no electricity trade in Asia/Oceania. Trade increased this year in the Americas by about 8% for Imports and Exports. In Europe, imported electricity in 2016 fell 8.7% to 386.1 TWh and electricity exports fell 9.8% to 378.4 TWh. Interestingly, several countries switched their trade balance from 2015 to 2016, with Portugal and Ireland switching from net importers to net exporters, and Spain, Switzerland and Poland switching from net exporters to net importers. France remained a net exporter, but decreased exports significantly due to Nuclear reductions. Sweden’s low Hydro production caused its exports to decrease.
Source: © 2017 OECD/IEA